Hello friends, Today I will share a method on how to create a graph in Google Sheets. Users can edit or create any type of graph. You can use several templates to create a graph in Google Docs. Users can create any presentation using Graph for their office or any other work. You can put any type of data in Google Sheets
If you are a businessman or an employee, then you will definitely know Google Sheets. Sometimes we fail to impress our clients because of the presentation. Some people still show old looking data in the form of a table. However, in this era, the tables are found to be old things. So, if you use Google Sheets to create data in the form of tables, then let me tell you that you can use it to make your data presentation modern and trendy looking.
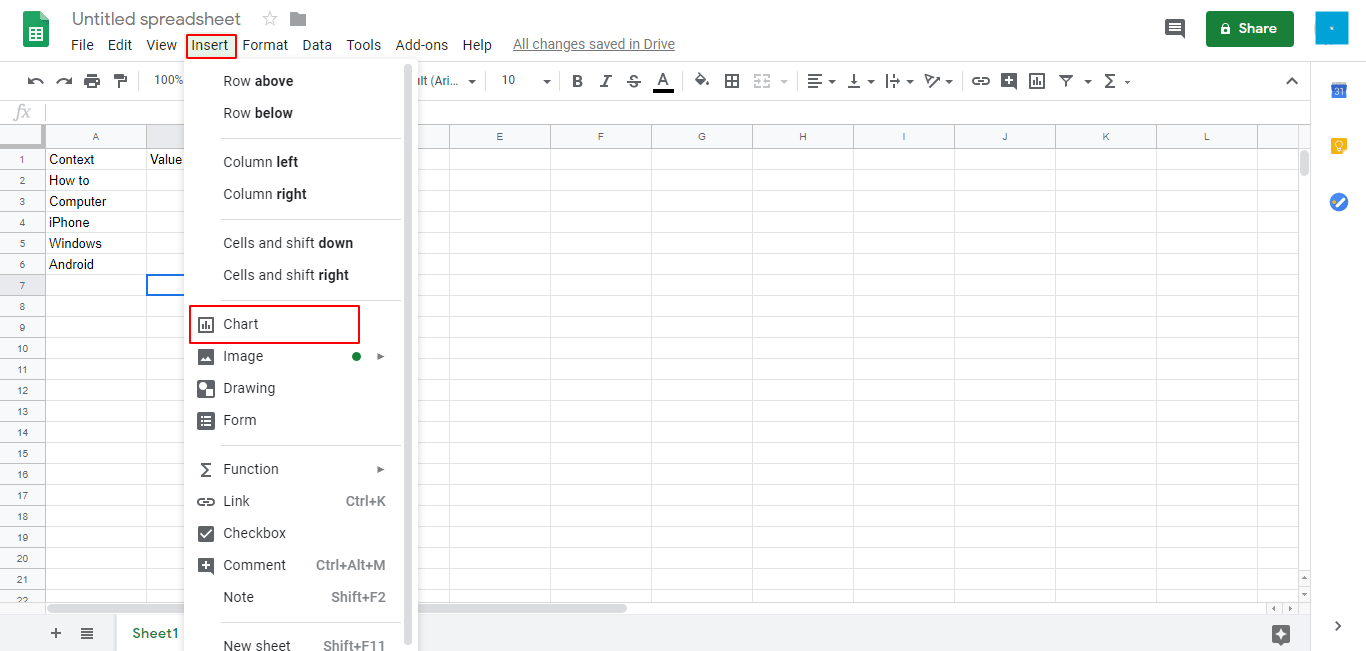
You can do so by creating a Graph in Google Sheets. Graphs are the best things to show a data record to someone else. They are easy to create as compared to table creation. Besides it, if you are new to Google Sheets and don’t know how to make a Spreadsheet in Google Docs then do learn it first.
There may be various methods available to create a graph in Google Sheets. But, this is the easiest way to create a Graph in Google Sheets using Google Sheets itself. Users can convert their old boring data into a modern and rich looking graph. Any user can create graphs like a line graph, area graph, combo graph, and more.
Plotting a graph in Google Sheet is very easy. Google always takes care of its users. In order to plot a graph in Google Sheets what you have to do is that just tab and hold the graph. And, take your mouse cursor where you want to plot your graph. Once the graph is successfully plotted, then you can customize it very easily.
Read more: How to Make a Spreadsheet in Excel
There are various types of graphs available for the Google Sheets users. Users can select any of the graphs to create the presentation in a modern style. Google Sheets already has all the possible graphs which the user looks for. Not even that, it also lets the users customize the graphs so that it can look like according to the users. If you want to check that your wished graph is available in Google Sheets or not then you can visit the Google Docs Editor Help.
This was the entire article about how you can create a graph in Google Sheets. There may be more methods available but this was the official way to do so. You can import your graphs also in Google Sheets. Besides it, you can also create a chart in Google Sheets. I hope you have successfully created a graph in Google Sheets. If you know any other person who needs it then do share it with that person so that it can be helpful for him or her.
This post was last modified on November 22, 2019 22:36
Discover how much cost for YouTube TV has to offer in terms of features, channel…
Learn how to change your background on a Chromebook. We have described a simple guide…
Learn which simple methods there are to open Terminal on Mac from Spotlight Search to…
Learn to add Safari page to home screen on your iPhone or iPad with this…
Learn how to hide Steam activity for privacy while you game. We will go over…
Learn how to turn off PS5 controller with these easy-to-follow methods, which include the Control…
This website uses cookies.